Pages

Showing posts with label ecg made easy. Show all posts

Sunday, June 21, 2009

A Systematic Approach to Electrocardiogram (EKG) Interpretation by Using 2 Mnemonics


This is a 2-step approach remembered by 2 mnemonics:

Step 1: Evaluate all elements of the EKG systematically: A RARE PQRST.

Step 2: Differential diagnosis. Look for diseases that may have caused the abnormalities noted in step 1: DR III EEE !

This systematic approach to reading electrocardiograms (ECGs or EKGs) works every time, just like a machine. By using it, you will not miss any major abnormalities in electrocardiograms (EKGs).

What is the meaning of the mnemonics?

A RARE PQRST:

Age, e.g. a 60-year patient is likely have a different pathology from a 30-year patient
Rate, e.g. fast or slow?
Axis, e.g. left or right?
Rhythm, e.g. regular or irregular?
Evaluate each EKG element as follows:
P wave, e.g. peaked or absent? PR interval - short or prolonged?
Q wave, e.g. deep Q wave? QT interval - - short or prolonged?
R wave, e.g. tall? look at QRS complex width for RBBB or LBBB
ST segment, e.g. elevation or depression?
T wave, e.g. peaked or inverted? U wave?

DR III EEE:

Drugs , e.g. Digoxin, tricyclic antidepressants
Rhythm and rate abnormalities, e.g. AV block of 1,2,3 degree, AFib, SVT? Interval prolongation?

Ischemia?
Infarct? Deep Q wave?
Infection, e.g. pericarditis

Enlargement, e.g. LVH, RVH, left or right atrium enlargement?
Electrolyte disturbances, e.g. hyperkalemia, hypokalemia, hypercalcemia,
Endocrine causes, e.g. hypothyroidism


TAKEN FROM clinicalcases.org

Tuesday, May 26, 2009

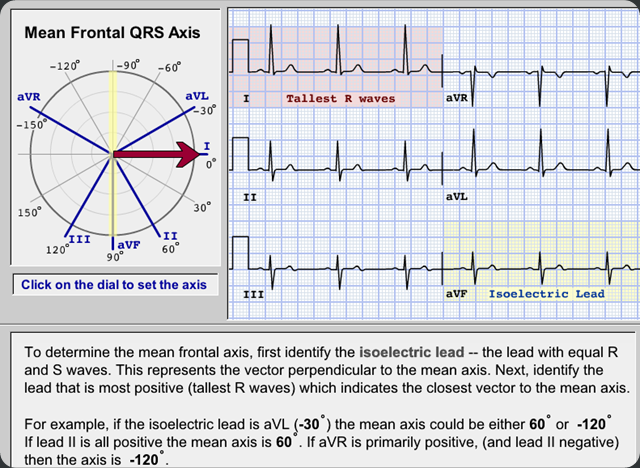
To determine the Mean Electrical Axis in ECG

Electrical axis...

  • Mean direction of the QRS complex in the frontal plane towards which the QRS complex is predominately pointed.
  • Since by definition it is calculated in frontal plane only, therefore MEAN ELECTRICAL AXIS is calculated only form the frontal or Limb leads.

Mean QRS Axis Calculation

  • the mean QRS axis is oriented at right angles (90°) to any lead showing a bi-phasic complex
  • the mean QRS axis points midway between any two leads that show tall R waves of equal height

This program demonstrates changes in the frontal surface leads with shifts in the cardiac axis .

mean axis calculation

Friday, June 27, 2008

Ecg leads

In this post we are going to deal with the various Ecg leads

we all know that the body acts as conductor of electricity & therefore recording electrode placed some distance from heart ,such as arms ,legs ,chest wall, are able to detect voltages conducted to these locations.

the usual way of recording ECG is by 12-lead ECG.

before going to depth lets first understand the difference b/w a ECG lead & an electrode.

  • electrode-it simply means the metal plate used to detect electrical currents of heart in any location
  • ECG lead-it shows the differences in voltages detected by electrodes.

12 LEAD ECG:

subdivided into 2 groups-

  • limb leads-extremity leads-6 in number(in frontal plane)
  • chest leads(precordial leads)-6 in number(in horizontal plane)

limb leads:has 2 groups-

  • bipolar limb leads:I, II, and III
  • unipolar augmented leads : aVR,aVL & aVF

{note:bipolar leads were so named because they record difference in electrical voltage b/w 2 extremities

unipolar lead records electrical voltages at one location relative to an electrode with zero potential.}

bipolar limb leads:

  • standard limb leads-I, II, and III
  • recorded first

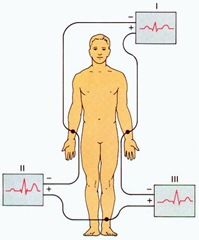
Limb_Leads

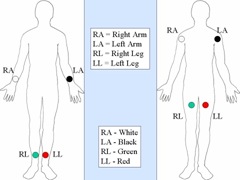
{note :here right leg electrode functions only as an electrical ground.although in theory it can be placed anywhere on the body. With a three-lead ECG, when one dipole is viewed, the remaining lead becomes the ground lead by default.}


ecglimb

Lead I : records difference in voltages between the right arm and left arm electrodes, the left arm being positive.

Lead I =LA-RA

Lead II :records difference in voltages between the right arm and left leg electrodes, the left leg being positive.

Lead II =LL-RA

Lead III : records difference in voltages between the left arm and left leg electrodes, the left leg again being positive.

Lead III =LL-LA

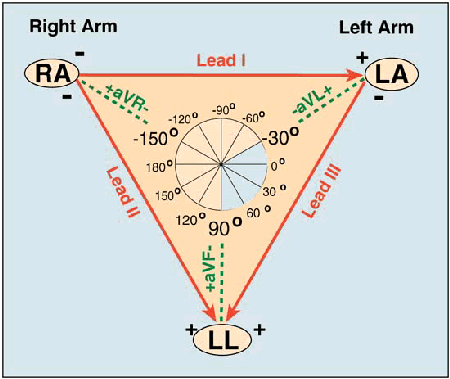
ecg_534

A diagrammatic representation of these three leads is termed Einthoven's triangle .

From the above three equations we get Einthoven's equation:

I +III = II.

It implies add the voltage in lead I to that in lead III & you get voltage in lead II.

{note: so it is a good practice to scan leads I, II, and III & if R wave in lead II does not seem to be sum of R wave in lead I & III , this may be clue that leads have not been mounted improperly}

augmented limb leads:

named as aVR,aVL & aVF :

  1. here 'a' stands for augmented
  2. V-voltage
  3. R ,L ,F-right arm ,left arm , & left foot respectively.

{note:

The augmented limb leads:

  • The electrode positions for the "augmented limb leads" are exactly the same as the electrode positions for the "standard limb leads," above.
  • An augmented limb lead measures electrical activity between the heart and the recording electrode.
  • However, all of the electrodes used here are "positive" electrodes.
  • Electrical activity traveling in a direction opposite to the lead being measured is determined as the average of the electrical activity measured at the other 2 electrodes. This sounds like a complex process, but it is all handled internally by the polygraph equipment doing the ECG recording.
  • Mathematically, what is really happening is that the electrical activity being measured by any lead is "augmented" (amplified) by about 50% by this mathematical relationship.
  • Using the acronyms VL (left shoulder), VR (right shoulder) and VF (left foot/leg):

aVL = VL - 0.5 (VR + VF) <---- simple formula for the "augmented left shoulder lead"

  • The simple formula above for the "augmented left shoulder lead" (aVL) shows us that aVL is determined as the electrical activity recorded at the electrode on the left shoulder (VL) minus the average difference (-0.5) from the electrical activity measured at the other 2 electrodes (VR + VF).
  • Now, let's see why this simple formula ends up amplifying the VL recording by 50%!!! In order to get started, we need to recognize that there exists a hypothetical "null" value at a central point over the heart where no fluctuations in electrical potential can be measured. In fact, this null point is demonstrated by algebraic summation of the electrical activity measured by all 3 limb leads... which adds to zero. So...
  1. VL + VR + VF = 0 (if we algebraically sum the electrical activity at all 3 electrodes, we get 0). Now, let's isolate the VL electrode...
  2. VL = - (VR + VF)..... Now, let's compare VL to the average value measured at the other 2 electrodes...
  3. 0.5 VL = -0.5 (VR + VF)... and what we see on the right side of this equation (-0.5 (VR + VF)) also appears on the right side of our simple aVL formula, above... so... let's replace the terms VR and VF in the simple aVL formula...
  4. aVL = VL - 0.5 (VR + VF) ..... becomes.... aVL = VL + 0.5 VL.... or, aVL = 1.5 VL... wow... so it appears, then, that aVL simply works out to be about 1.5 times the electrical activity recorded by VL. So, aVL is truly an augmented lead!

To summarize, then: An augmented limb lead is determined by measuring the electrical activity at a chosen limb lead, and then subtracting the average of the electrical activity measured at the other 2 limb leads. The net effect of this process is to augment the lead of interest by 50%.

The lead on the left arm is known as aVL (L for left), the lead on the right arm as aVR (R for right) and the lead on the left leg as aVF (F for foot). As the tracings are electrically "augmented" by comparison with the hypothetical null point over the center of the heart, at which no electrical potentials can be measured, the leads are referred to as "augmented leads."}

{note: now we know that

aVR +aVL +aVF=0

therefore it means -

sum of P waves in these three leads is 0

sum of QRS voltages is 0

sum of T wave voltages is 0.

{note :therefore ,when we scan the ECG for these leads & if the sum of waves in these leads does not equal 0 , then the leads might have been incorrectly placed.}

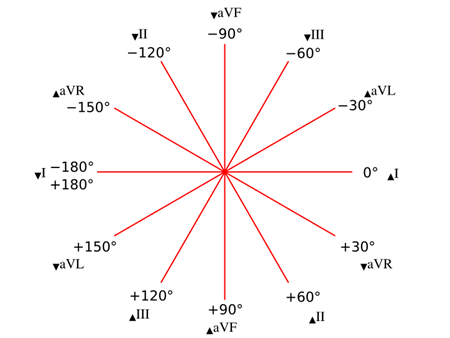
Hexaxial diagram:

the ECG leads have 2 important features:

  • specific orientation(eg:lead I - oriented horizontally)
  • specific polarity( eg" lead I - has positive polarity towards left side)

you can understand the remaining by looking at this diagram.

718px-Hexaxial_reference_system.svg

up arrow -positive pole & down arrow - negative pole.

It is used to help determine the heart's electrical axis in the frontal plane.{we will lran about this important concept in the next post}

{note: this is very important diagram & try to remember it BYHEART}

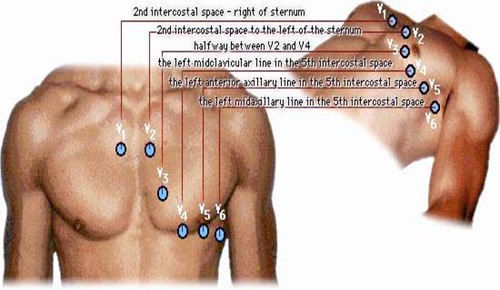
Chest leads:

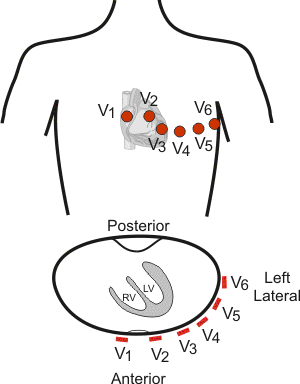
  • The precordial leads V1, V2, V3, V4, V5, and V6 are placed directly on the chest.
  • Because of their close proximity to the heart, they do not require augmentation.

precordial1

  • The precordial leads view the heart's electrical activity in the so-called horizontal plane. The heart's electrical axis in the horizontal plane is referred to as the Z axis.
  • Leads V1, V2, and V3 are referred to as the right precordial leads and V4, V5, and V6 are referred to as the left precordial leads.
  • Wilson's central terminal is used for the negative electrode, and these leads are considered to be unipolar.

A013c ECG chest leads

Leads group
V1, V2, V3, V4 Anterior
I, AVL, V5, V6 Left lateral
II, III, AVF Inferior

additional leads:

The "Lewis lead" :

  • it is a bipolar lead with a negative electrode in the 2nd intercostal space on the right side and a positive electrode in the 4th intercostal space on the right side; a ground is placed in the 2nd intercostal space on the left side with all electrodes placed close to the sternum.
  • used to detect atrial flutter waves when atrial flutter is suspected clinically but not definitely demonstrated on the standard 12 lead EKG.
  • In order to create the Lewis Lead, move the right arm electrode to the right, second intercostal space adjacent to the sternum. Then move the left arm electrode to the right, fourth intercostal space adjacent to the sternum.
  • The Lewis Lead is then read as Lead I on the EKG and, since in most patients it will be roughly perpendicular to the wave of atrial depolarization, flutter waves may be more apparent.

Internal leads: Electrode locations need not be in the "traditional" locations (ie. the arms, chest or back). Electrodes could also be located in the thoracic portion of the lumen of the esophagus, within the cardiac chambers, on the surface of the heart or within the AV bundle.

  • The AV bundle electrogram gives very direct information about the major conducting elements of the heart.

We will learn the importance of these leads in diagnosing various disorders of heart in subsequent posts.


Wednesday, June 18, 2008

Basic ECG waveform & ECG vitals

basic ecg wave consists of waves :

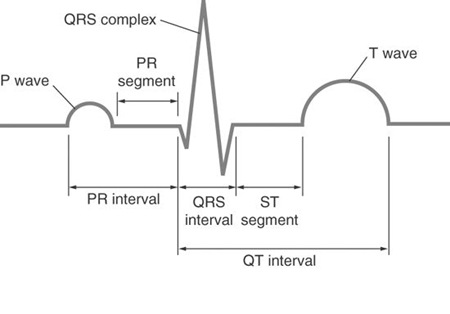
P wave:represents atrial depolarisation

QRS complex:ventricular depolarisation

ST segment,T wave & U wave:ventricular repolarisation.

now you may have a doubt of where the atrial repolarisation has gone?answer is the atrial ST segment(STa) & atrial T wave(Ta) are generally not observed on normal ecg because of their low amplitudes.

exception: acute pericarditis causes PR segment deviation.

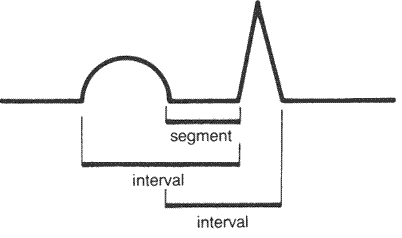
A segment is a straight line connecting two waves, whereas an interval encompasses at least one wave plus the connecting straight line.

segments

seg

WE will discuss about "Vital signs" of the ECG.

As soon as you see an ECG,scan for these 4 things in the first look itself .they are:

  • heart rate
  • PR interval
  • QRS width
  • QT interval.


Heart rate:

normal heart rate :60-100 beats/min.

if more than 100 beats/min-tachycardia

if less than 60 beats/min-bradycardia

we will discuss the conditions which cause them in future posts.now we will learn to measure it at one glance.

2 methods:

Box counting methods-if heart rate is regular

Count the number of large boxes(0.2 sec boxes) b/w 2 successive QRS complexes & divide 300 by it.{300 * 0.2=60 & heart rate is measured for 60 sec}

example-in the below ecg no. of large boxes b/w 2 successive QRScomplexes is 3.

therefore heart rate=300/3=100 beats/min

if u want to measure even more accurately ,count the no. of small(0.0 sec) boxes b/w 2 successive QRScomplexes and divide 1500 with it.{1500*0.04=60}

QRS counting methods-if heart rate is irregular.

Count the no. of QRS complexes in 6 second intervals & then multiply it by 10.

The PR Interval:

  • The PR interval is the time from the beginning of the P wave until the beginning of the QRS complex.
  • it is normally between 0.12 and 0.2 seconds (three to five small boxes) in length.
  • The PR interval may be prolonged when conduction of the electrical wave through the AV node is slow. This may be seen with degenerative disease of the node, or with digoxin, hyperkalemia, hypercalcemia, or hypothermia.
  • The PR interval may be unusually short when conduction is rapid. A mildly short PR interval may be seen with hypokalemia or hypocalcemia. An artificially-short PR interval occurs when the QRS complex begins early, as happens with an extra conducting bundle — Wolff-Parkinson-White Syndrome (WPW).
  • Following the P wave is the PR segment. (NOTE: the PR segment and the PR interval are NOT the same thing.) The PR segment is not routinely measured, but may be commented on if it is depressed or elevated. During the PR segment, the electrical wave moves slowly through the atrioventricular (AV) node. This activity is not seen on the ECG.

if PR interval > 0.2 sec -called "First degree heart block"

The QRS width:

  • If the first deflection of the QRS is downward, it’s called a Q wave. The Q wave represents activation of the ventricular septum.
  • The first upward deflection of the QRS is called the R wave. Most of the ventricle is activated during the R wave.
  • The S wave is any downward deflection following the R wave.
  • If a second upward deflection is seen, it’s called an R-prime wave(R' wave).
  • QRS complexes may be described by naming the waves that form them. For example, a complex with an R, an S, and an R’ is called an RSR’ complex.

clinical aspects:

  1. Q waves may be normal. For example in lead I, a Q less than 1/4 of the R height, and less than one box wide, is considered normal. This is the early activation of the septum. This activation goes left — away from lead I — and is therefore negative on the ECG. “Septal Qs” are normal in I, F, V5 and V6. Qs are also generally innocent in lead III and lead V1 if no other abnormality is seen.
  2. Q waves are “significant” if they are greater than 1 box in width (longer than 0.04 msec) OR are larger than 1/4 of the R wave. Significant Q waves indicate either myocardial infarction or obstructive septal hypertrophy (IHSS).
  3. The R wave may be prolonged if the ventricle is enlarged, and may be abnormally high (indicating strong voltage) if the ventricular muscle tissue is hypertrophied.
  4. Like the R wave, an abnormally large S wave may indicate hypertrophy of the ventricle
  5. R-prime waves are never normal, but indicate a problem in the ventricular conduction system.

QT interval:

The QT interval is the time from the beginning of the QRS complex until the end of the T wave. The “normal” QT length varies with heart rate. Very fast rates shorten the QT length.

QT interval should be measured in the ECG lead that shows the longest interval.

as it changes with heart rate ,a rate corrected QT interval(QTc) has been devised.

  1. Bazett equation=QTc=QT/square root of RR interval.
  2. RR=b/w 2 successive R waves.
  3. normally QTc is less than or equal to about 0.44 sec.

clinical aspects:

QT interval shortened-

  1. digitalis(in therapeutic doses)
  2. hypercalcemia.

QT prolongation predisposes to Torsade de Pointes(distinctive polymorphic ventricular tachycardia in which the QRS amplitude varies and the QRS complexes appear to twist around the baseline)

QT prologation:

1.congenital(hereditary) long QT syndromes:

  1. Romano-Ward syndrome(autosomal dominant)
  2. Jervell & Lange-Nielson syndrome(autosomal recessive with congenital deafness)

2.Acquired long Qt syndromes:

a.electrolyte abnormalities-

  1. hypocalcemia
  2. hypokalemia
  3. hypomagnesemia

b.drugs:

  1. class 1A or 3 antiarrhythmic agents(amiodarone,disopyramide,dofetilide,ibutilide,procainamide,quinidine,sotalol)
  2. antihistamines(astemizole,terfenadine)
  3. antianginal(bepridil)
  4. antimalarial(chloroquine,halofantrine)
  5. psychotropics(phenothiazines,tricyclic antidepressants,haloperidol)
  6. Gastrointestinal stimulant(cisapride)
  7. antinausea(domperidone,droperidol)
  8. antibiotics(clarithromycin,erythromycin,pentamidine,sparfloxacin)
  9. antilipemic(probucol)
  10. opiate agonist(methadone.levomethadyl)
  11. diuretic(indapamide)

c.myocardial ischemia or infarction.

d.cerebrovascular injury

e.systemic hypothermia.

f.bradyarrhythmias.

g.others:

  1. liquid protein diets
  2. starvation
  3. myocarditis
  4. arsenic poisoning

IN the next post we will discuss about P wave,ST segment,T wave,U wave & also about ECG leads.


Tuesday, June 17, 2008

Ecg paper

480px-ECG_Paper_v2.svg

  • A typical electrocardiograph runs at a paper speed of 25 mm/s
  • Each small block of ECG paper is 1 mm². At a paper speed of 25 mm/s, one small block of ECG paper translates into 0.04 s (or 40 ms).
  • notice that the line b/w every five boxes are heavier,so that each 5mm unit horizontally corresponds to 0.2 sec.


  • vertically,ecg graph measures voltages or amplitudes of waves.the exact voltages can be measured because the electrocardiograph is standardised (calibrated) so that a 1mV signal produces a deflection of 10mm amplitude (1mV=10mm).
  • suppose in patients with electronic pacemakers that produces very large spikes or high QRS voltages caused by hypertrophy,it is advisable to take ecg at half standardization (1mV=5mm) to get the entire tracing on paper.
  • if ecg complexes are very small ,it is advisable to take ecg at double standardization (1mV=20mm) to study more clearly.

Tuesday, June 3, 2008

ecg made easy.

This is first of a set of articles on ecg which i am going to post to make u understand basics and help u interpret even the toughest of ecgs.

Today we start with introduction:

first know the difference b/w electrocardiogram & electrocardiograph- 

electrocardiogram:electro, because it is related to electrical activity, cardio, Greek for heart, gram, a Greek root meaning "to write"800px-12leadECG1

  electrocardiograph:instrument used to record . 

NK_Cardiofax electrocardiograph1

basics:Electrical waves cause the heart muscle to pump. These waves pass through the body and can be measured at electrodes (electrical contacts) attached to the skin. Electrodes on different sides of the heart measure the activity of different parts of the heart muscle. An ECG displays the voltage between pairs of these electrodes, and the muscle activity that they measure, from different directions. This display indicates the overall rhythm of the heart, and weaknesses in different parts of the heart muscle. It is the best way to measure and diagnose abnormal rhythms of the heart, particularly abnormal rhythms caused by damage to the conductive tissue that carries electrical signals, or abnormal rhythms caused by levels of dissolved salts (electrolytes), such as potassium, that are too high or low.

note:ecg does not record all the hearts electrical activity.the electrodes placed on surface of body record only currents that are transmitted to area of electrode placement.therefore there are actually "silent areas" of heart.the ecg records only currents produced by working heart muscle.
for example-1.ecg is not sensitive enough to record depolarisation of pacemaker cells in sinus node

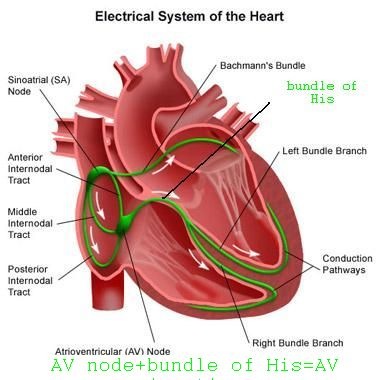
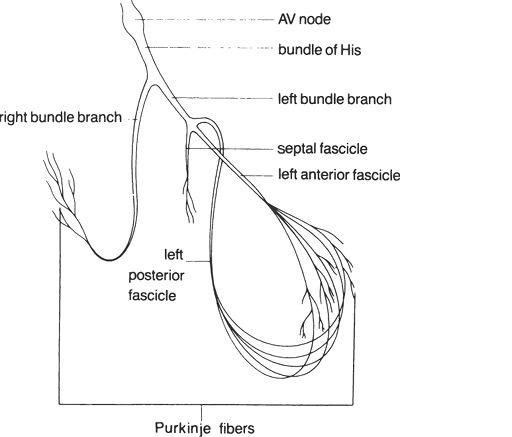
      2.the conventional ecg does not detect the spread of stimuli through AV junction-this is recorded using a special apparatus & special electrode placed in heart {His bundle electrogram }

ei_00181

3.conduction:fastest through purkinje fibres

                        slowest:AV node{because it allows ventricles time  to fill with blood before signal for cardiac contraction arrives}

left bundle

that's for today, in the next topic we will deal with basic ecg waves & ecg leads.